Following on from a previous article on creating simple lens flare effects using compute shaders we can get some help from RenderDoc to find a faster version of that shader.
The Goal
We're given a large texture and want to find the brightest pixel within each 8x8 square over the image, but only if it's over a certain luminance threshold. Previously we created a compute shader that achieves that, but it felt like it had room to improve.
Starting Point
Our previous shader uses a thread group size of 8×8, with each thread accessing the colour at its location and calculating its luminance. Then one of the threads goes through all those results to find the brightest. Here's the code for the important part:
#define GROUP_SIZE 8
groupshared BrightPoint cachedPoint[GROUP_SIZE][GROUP_SIZE];

#pragma kernel FindBrights
[numthreads(GROUP_SIZE, GROUP_SIZE, 1)]
void FindBrights (uint3 globalId : SV_DispatchThreadID, uint3 localId : SV_GroupThreadID)
{
  // every thread samples one texel
  float3 colour = _sourceTexture[globalId.xy];
  float luminance = CalculateLuminance(colour);

  // and stores the result in groupshared memory
  cachedPoint[localId.x][localId.y] = MakeBrightPoint(
    globalId.xy, colour, luminance
  );
  GroupMemoryBarrierWithGroupSync();

  // all but one thread stops here
  if (!(localId.x == 0 && localId.y == 0))
  {
    return;
  }

  // one thread finds the highest luminance in the group.
  bool foundBright = false;
  BrightPoint brightest = MakeBrightPoint(
    int2(0,0), float3(0,0,0), _luminanceThreshold
  );
  for (int y = 0; y < GROUP_SIZE; ++y)
  for (int x = 0; x < GROUP_SIZE; ++x)
  {
    if (cachedPoint[x][y].luminance > brightest.luminance)
    {
      foundBright = true;
      brightest = cachedPoint[x][y];
    }
  }

  if (foundBright)
  {
    _brightPoints.Append(brightest);
  }
}
Measured performance: 360µs
The weakness is that for a significant amount of execution time only one of the threads in each group is doing anything useful. GPUs are really good at running lots of threads at once, so we may be squandering the hardware's potential here.
The Measure of a Shader
To accurately compare implementation we need to be able to measure their performance. It's very hard to do that accurately from the CPU side. You could try to use Unity's profiling tools or make your own version measuring the time before after after calling Dispatch. But this doesn't give accurate information on how long the shader itself is taking to complete. The shader might not have started running when you get to the EndSample() line. The CPU and GPU really are separate pieces of hardware and don't operate in lockstep.
// this wouldn't give accurate measurements for the shader
Profiling.Profiler.BeginSample("Compute for finding brights");
brightsCompute.Dispatch(...);
Profiling.Profiler.EndSample();
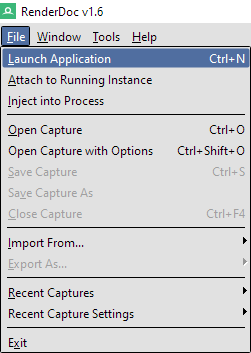
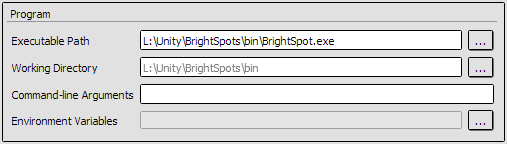
Instead we'll be using RenderDoc to let us poke around at what is happening on the graphics card, at least on an abstracted level. To get started we'll need to make a standalone build of our "game" from within Unity, then launch it through RenderDoc. Once Unity is done building, select Launch Application from RenderDoc's File menu. Over on the right of the window you should see a field to select your executable. The other options can generally be left as-is, so just click Launch.
You're not limited to putting your own applications through RenderDoc. It can be fiddly to get working on some games, but you can have an interesting time looking at how other people are doing their rendering.
Your game will now run as normal but with a framerate info overlay at the top-left of the display. As that says you can press F12 or PrtSc at any time to record a frame. It's normal for the game to pause for a moment while storing that frame. When you close the game, RenderDoc should have your captured frame(s) ready to examine.
There's a lot of information available from RenderDoc and I'll not even attempt to go through it here. We're just using one feature for now. Over on the left should be the Event Browser that lists in order all the rendering events from the frame you captured. When you click the clock icon RenderDoc will run the events again and use GPU-based timing to measure how long they each take. The result will appear next to each event, measured in µs (each is one millionth of a second, so you can afford to spend 16,666µs on a frame before dropping below 60FPS.) Notice that the measured value will vary a bit each time you click, so it's good to take a few measurements and average them.
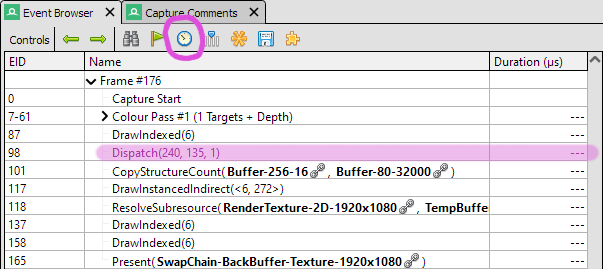
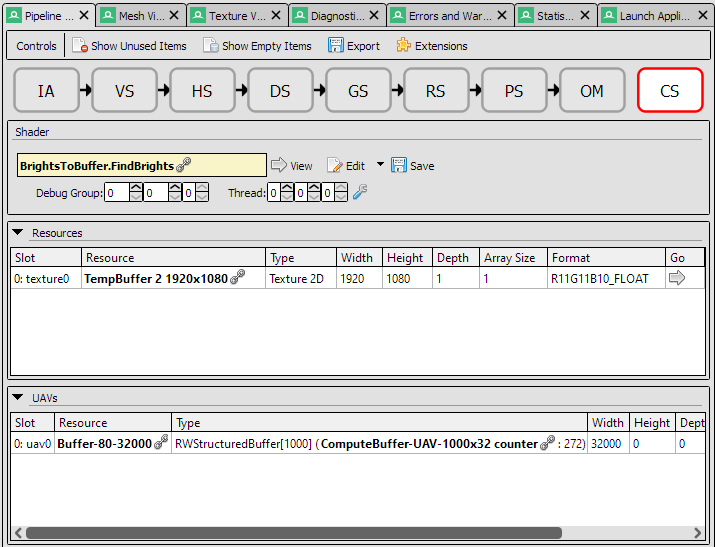
In this case there's just one Dispatch event so that must be the compute shader we're interested in. But you can check by selecting that event, then looking in the Pipeline State tab. You can click the large CS icon near the top of that to see details on what the Compute Shader is doing. In this case it shows that it has a 1920×1080 texture (the source image we're searching for bright points) and a RWStructuredBuffer (the append buffer we'll write any bright points to.) We can also confirm that it's the FindBrights kernel in the BrightsToBuffer shader file. Try clicking around, you'll find you can see what data was in the buffer, what the texture looked like, and read a decompiled version of the shader.
Multiple Samples per Thread
Now that we can measure performance let's try some alternative algorithms for finding bright pixels.
We were concerned about wasting resources by having idle threads so let's make a version that keeps every thread busy. Each thread will examine a complete 8×8 area on its own. As before here's the core of the code:
#define GROUP_SIZE 32
#define REGION_PER_THREAD 8

#pragma kernel FindBrights
[numthreads(GROUP_SIZE, GROUP_SIZE, 1)]
void FindBrights (uint3 globalId : SV_DispatchThreadID, uint3 localId : SV_GroupThreadID)
{
  BrightPoint brightest = MakeBrightPoint(int2(0,0), float3(0,0,0), _luminanceThreshold);
  bool foundBright = false;

  // every thread examines a square of REGION_PER_THREAD x REGION_PER_THREAD texels
  int xStart = globalId.x * REGION_PER_THREAD;
  int yStart = globalId.y * REGION_PER_THREAD;
  for (int y = yStart; y < yStart + REGION_PER_THREAD; ++y)
  for (int x = xStart; x < xStart + REGION_PER_THREAD; ++x)
  {
    float3 colour = _sourceTexture[int2(x, y)];
    float luminance = CalculateLuminance(colour);
    if (luminance > brightest.luminance)
    {
      brightest = MakeBrightPoint(int2(x, y), colour, luminance);
      foundBright = true;
    }
  }
  if (foundBright)
  {
    _brightPoints.Append(brightest);
  }
}
Measured performance: 900µs
It's quite a lot slower. It was reasonable to think this could work as we're not idling threads and don't need to worry about syncing between threads. But it seems that doesn't make up for the time it takes to serially access a texture 64 times. It pays to test.
I suspect the problem here is we're messing up texture cache coherence. When in doubt blame cache coherence. The ideal way to access a texture multiple times is to access texels close to one another. Usually nearby texels are pulled into the texture cache along with the one you actually read from. But in this case we have each thread accessing a texel at least 8 away from where any of the other threads are accessing. Keep in mind the other threads are accessing the texture at the same time. If the texture cache is big enough that wouldn't be a problem, but I suspect we're not in that situation.
Shared Search
Now let's go back to something closer to the original design so each thread is dealing with just one texel. But now we'll try to share out the task of finding the brightest pixel. Instead of having just one thread do it alone we can at least have some others help.
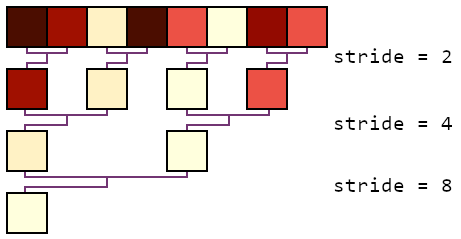
As a first step we can have all the even numbered threads (0, 2, 4, 6, ...) compare their brightness to the thread on their right. If their neighbour's point is brighter, use it to replace our own. We now know that the brightest pixel in the whole row is definitely in one of the even numbered threads. We can repeat that process but using just half of those threads (0, 4, ...) and now looking at the neighbour from the previous stage.
Each repeat of the process cuts down the active threads by half until there's just one left. Once that last iteration is complete we know thread 0 will have the brightest in it. That will have found the brightest point in each row. We can repeat the same process to now find the brightest of those rows. It may not feel as intuitive to understand as having just one thread look through everything, but it does keep much more of the threads doing useful work.
#define GROUP_SIZE 8
groupshared BrightPoint cachedPoint[GROUP_SIZE][GROUP_SIZE];

#pragma kernel FindBrights
[numthreads(GROUP_SIZE, GROUP_SIZE, 1)]
void FindBrights (uint3 globalId : SV_DispatchThreadID, uint3 localId : SV_GroupThreadID)
{
  // every thread samples one texel
  float3 colour = _sourceTexture[globalId.xy];
  float luminance = CalculateLuminance(colour);

  cachedPoint[localId.x][localId.y] = MakeBrightPoint(
    globalId.xy, colour, luminance
  );
  GroupMemoryBarrierWithGroupSync();

  // Rather than having just one thread do the search, share the work somewhat.
  // There will still be at least 50% of threads inactive during this, with the
  // higher stride values having more inactive threads
  uint stride;
  for (stride = 2; stride <= GROUP_SIZE; stride *= 2)
  {
    if ((localId.x % stride) == 0)
    {
      if (cachedPoint[localId.x + stride / 2][localId.y].luminance >
          cachedPoint[localId.x][localId.y].luminance)
      {
        cachedPoint[localId.x][localId.y] = cachedPoint[localId.x + stride / 2][localId.y];
      }
    }
    GroupMemoryBarrierWithGroupSync();
  }
  // brightest in each row is now [0] of that row

  for (stride = 2; stride <= GROUP_SIZE; stride *= 2)
  {
    if (localId.x == 0 && (localId.y % stride) == 0)
    {
      if (cachedPoint[0][localId.y + stride / 2].luminance >
          cachedPoint[0][localId.y].luminance)
      {
        cachedPoint[0][localId.y] = cachedPoint[0][localId.y + stride / 2];
      }
    }
    // group sync must be outside of any conditionals, every thread need to reach it
    GroupMemoryBarrierWithGroupSync();
  }
  // brightest in whole group is now in [0][0]

  // final step is always only done on one thread
  if (localId.x == 0 && localId.y == 0)
  {
    BrightPoint brightest = cachedPoint[0][0];
    if (brightest.luminance > _luminanceThreshold)
    {
      _brightPoints.Append(brightest);
    }
  }
}
Measured performance: 200µs
A slight gain! Although half the threads are wasted for the whole search process it still shares out the work and gets it done a little faster than the original. The improvement should be greater for large thread group sizes too.
Why Not Both?
Trying to sample the whole 8×8 area in each thread didn't work out, but I feel hopeful we can do something useful with cache coherency. This version will have each thread sample a few (nearby) texels, find their brightest, store that, and then we do the group-wide search on that smaller set of bright pixels.
#define GROUP_SIZE 4
#define REGION_PER_THREAD 2

#pragma kernel FindBrights
[numthreads(GROUP_SIZE, GROUP_SIZE, 1)]
void FindBrights (uint3 globalId : SV_DispatchThreadID, uint3 localId : SV_GroupThreadID)
{
  // every thread examines a square of REGION_PER_THREAD x REGION_PER_THREAD texels
  BrightPoint brightest = MakeBrightPoint(int2(0,0), float3(0,0,0), _luminanceThreshold);
  int xStart = globalId.x * REGION_PER_THREAD;
  int yStart = globalId.y * REGION_PER_THREAD;
  for (int y = yStart; y < yStart + REGION_PER_THREAD; ++y)
  for (int x = xStart; x < xStart + REGION_PER_THREAD; ++x)
  {
    float3 colour = _sourceTexture[int2(x, y)];
    float luminance = CalculateLuminance(colour);
    if (luminance > brightest.luminance)
    {
      brightest = MakeBrightPoint(int2(x, y), colour, luminance);
    }
  }

  cachedPoint[localId.x][localId.y] = brightest;
  GroupMemoryBarrierWithGroupSync();

  // search for brightest in each row
  uint stride;
  for (stride = 2; stride <= GROUP_SIZE; stride *= 2)
  {
    if ((localId.x % stride) == 0)
    {
      if (cachedPoint[localId.x + stride / 2][localId.y].luminance >
          cachedPoint[localId.x][localId.y].luminance)
      {
        cachedPoint[localId.x][localId.y] = cachedPoint[localId.x + stride / 2][localId.y];
      }
    }
    GroupMemoryBarrierWithGroupSync();
  }
  // brightest in each row is now [0] of that row

  for (stride = 2; stride <= GROUP_SIZE; stride *= 2)
  {
    if (localId.x == 0 && (localId.y % stride) == 0)
    {
      if (cachedPoint[0][localId.y + stride / 2].luminance >
          cachedPoint[0][localId.y].luminance)
      {
        cachedPoint[0][localId.y] = cachedPoint[0][localId.y + stride / 2];
      }
    }
    // group sync must be outside of any conditionals, even the idle threads need to reach it
    GroupMemoryBarrierWithGroupSync();
  }
  // brightest in whole group is now in [0][0]

  // final step is always only done on one thread as want to add at most one to _brightPoints
  if (localId.x == 0 && localId.y == 0)
  {
    BrightPoint brightest = cachedPoint[0][0];
    if (brightest.luminance > _luminanceThreshold)
    {
      _brightPoints.Append(brightest);
    }
  }
}
Measured performance: 110µs
I think that's about as good as we'll get for now. We can try tweaking the REGION_PER_THREAD and GROUP_SIZE values, but at least on this machine we're at the optimal balance. You might notice that as GROUP_SIZE is now 4 those search loops only iterate through twice. It's tempting to manually unroll them, as "everyone knows" conditionals and loops are bad for shaders. Fortunately you can add [unroll] immediately before a for loop and the compiler will do that work for us without making our code harder to maintain. Even more fortunately the compiler seems to do a decent job of judging when to automatically unroll loops even without prompting. Thanks, compilers.
The base project is available via the original article. A variation with each of these alternate shaders are available as branches on the GitHub project. The version with many samples per thread and no cross-thread communication. One sample per thread but with shared search. And finally, multiple samples per thread with shared search.